Science Modules / Phytoplankton
The approach to simulate algal biomass is to adopt several plankton functional types (PFTs) that are typically defined based on specific groups such as diatoms, dinoflagellates and cyanobacteria. Whilst each group that is simulated is unique, they share a common mathematical approach and each simulate growth, death and sedimentation processes, and customisable internal nitrogen, phosphorus and/or silica stores if desired. Distinction between groups is made by adoption of groups specific parameters for environmental dependencies, and/or enabling options such as vertical migration or N fixation.
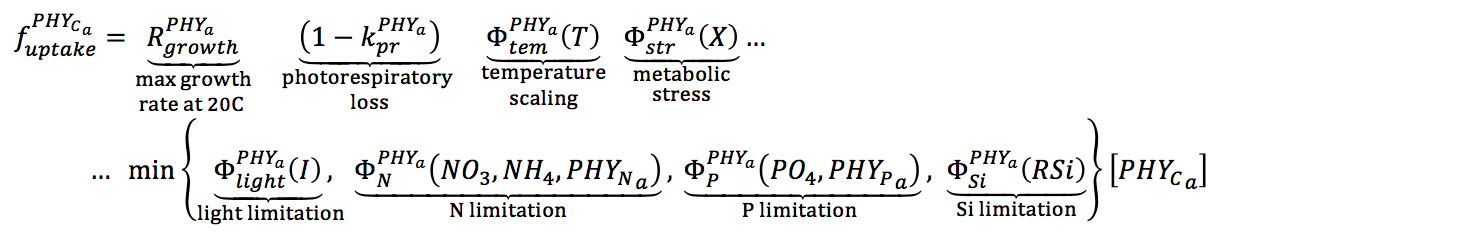
For each phytoplankton group, the maximum potential growth rate at 20°C is multiplied by the minimum value of expressions for limitation by light, phosphorus, nitrogen and silica (when configured). While there may be some interaction between limiting factors, a minimum expression is likely to provide a realistic representation of growth limitation (Rhee and Gotham, 1981).
Goto Parameter Databaseaed2_phytoplankton : Mass balance and functions related to the phytoplankton model
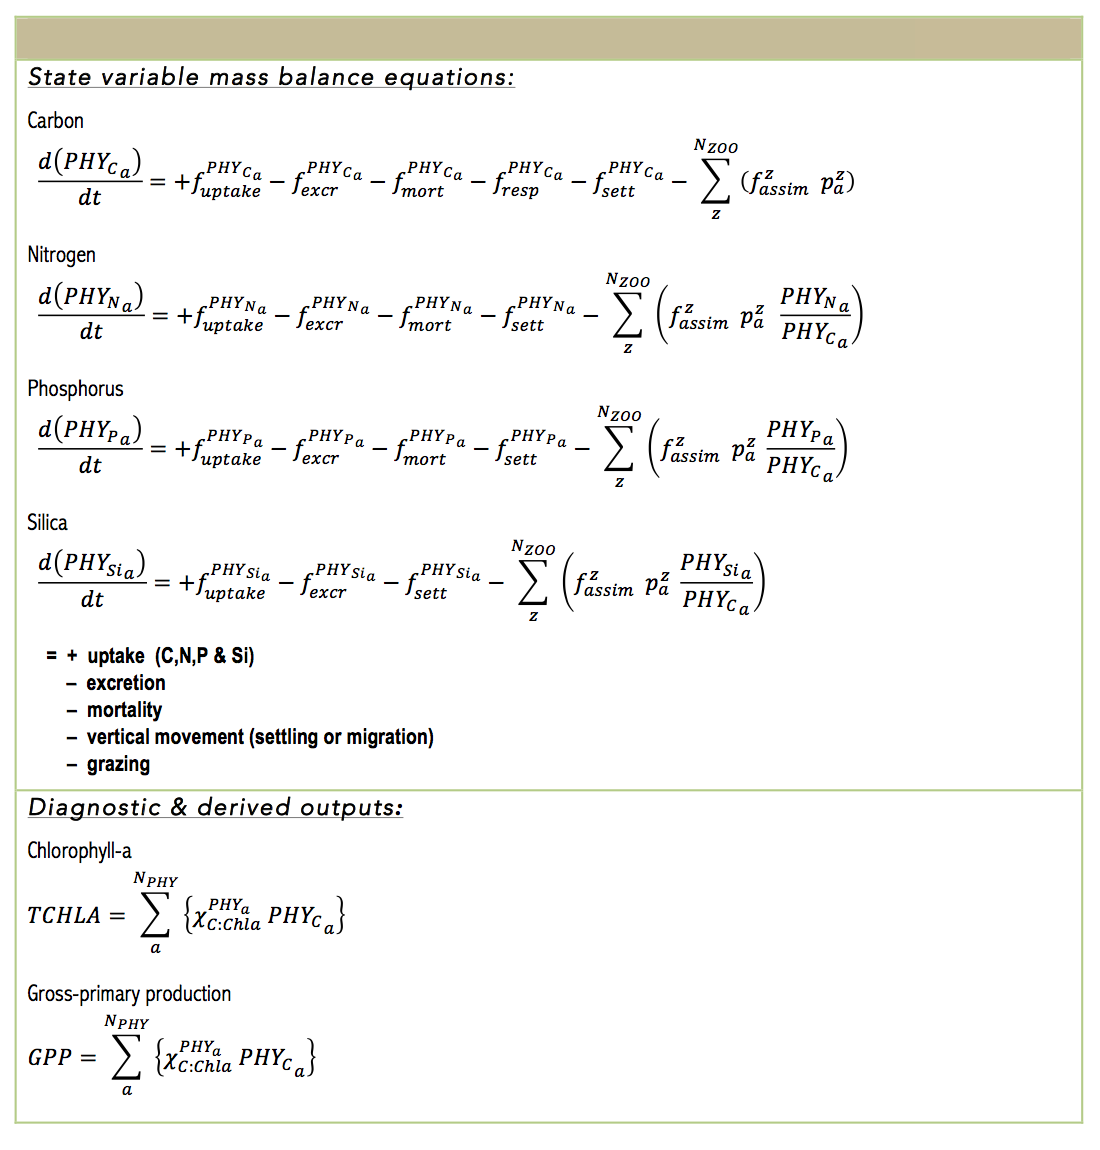
The algal biomass of each group, PHYC, is simulated in units of carbon (mmol C m-3), and the group can be configured to have a constant C:N:P:Si ratio, or have dynamic uptake of N and P sources in response to changing water column condition and cellular physiology. Balance equations that capture the various processes impacting phytoplankton are outlined in the below table.
aed2_phytoplankton : photosynthesis and nutrient uptake
For each phytoplankton group, the maximum potential growth rate at 20°C is multiplied by the minimum value of expressions for limitation by light, phosphorus, nitrogen and silica (when configured). While there may be some interaction between limiting factors, a minimum expression is likely to provide a realistic representation of growth limitation (Rhee and Gotham, 1981).
Therefore, photosynthesis is parameterized as the uptake of carbon, and depends on the temperature, light and nutrient dimensionless functions (adopted from Hipsey & Hamilton, 2008; Li et al., 2013).
The temperature function is calculated according to (Griffin et al. 2001):

where \(c1_a\) and \(c0_a\) are solved numerically given input values of: \(T^{std}_a\), \(T^{opt}_a\) and \(T^{max}_a\).
The level of light limitation on phytoplankton growth can be modelled as photoinhibition or non-photoinhibition. In the absence of significant photoinhibition, Webb et al. (1974) suggested a relationship for the fractional limitation of the maximum potential rate of carbon fixation for the case where light saturation behaviour was absent (Talling, 1957), and the equations can be analytically integrated with respect to depth (Hipsey and Hamilton, 2008). For the case of photoinhibition, the light saturation value of maximum production (IS) is used and the net level effect can be averaged over the cell by integrating over depth.
The aed_phytoplankton module contains several light functions, including those from a review by Baklouti et al. (2006). The user must select the sensitivity to light according to a photosynthesis-irradiance (P-I curve) formulation and each species must be set to be either non-photoinhibited or photoinhibited according to the options in the table below:
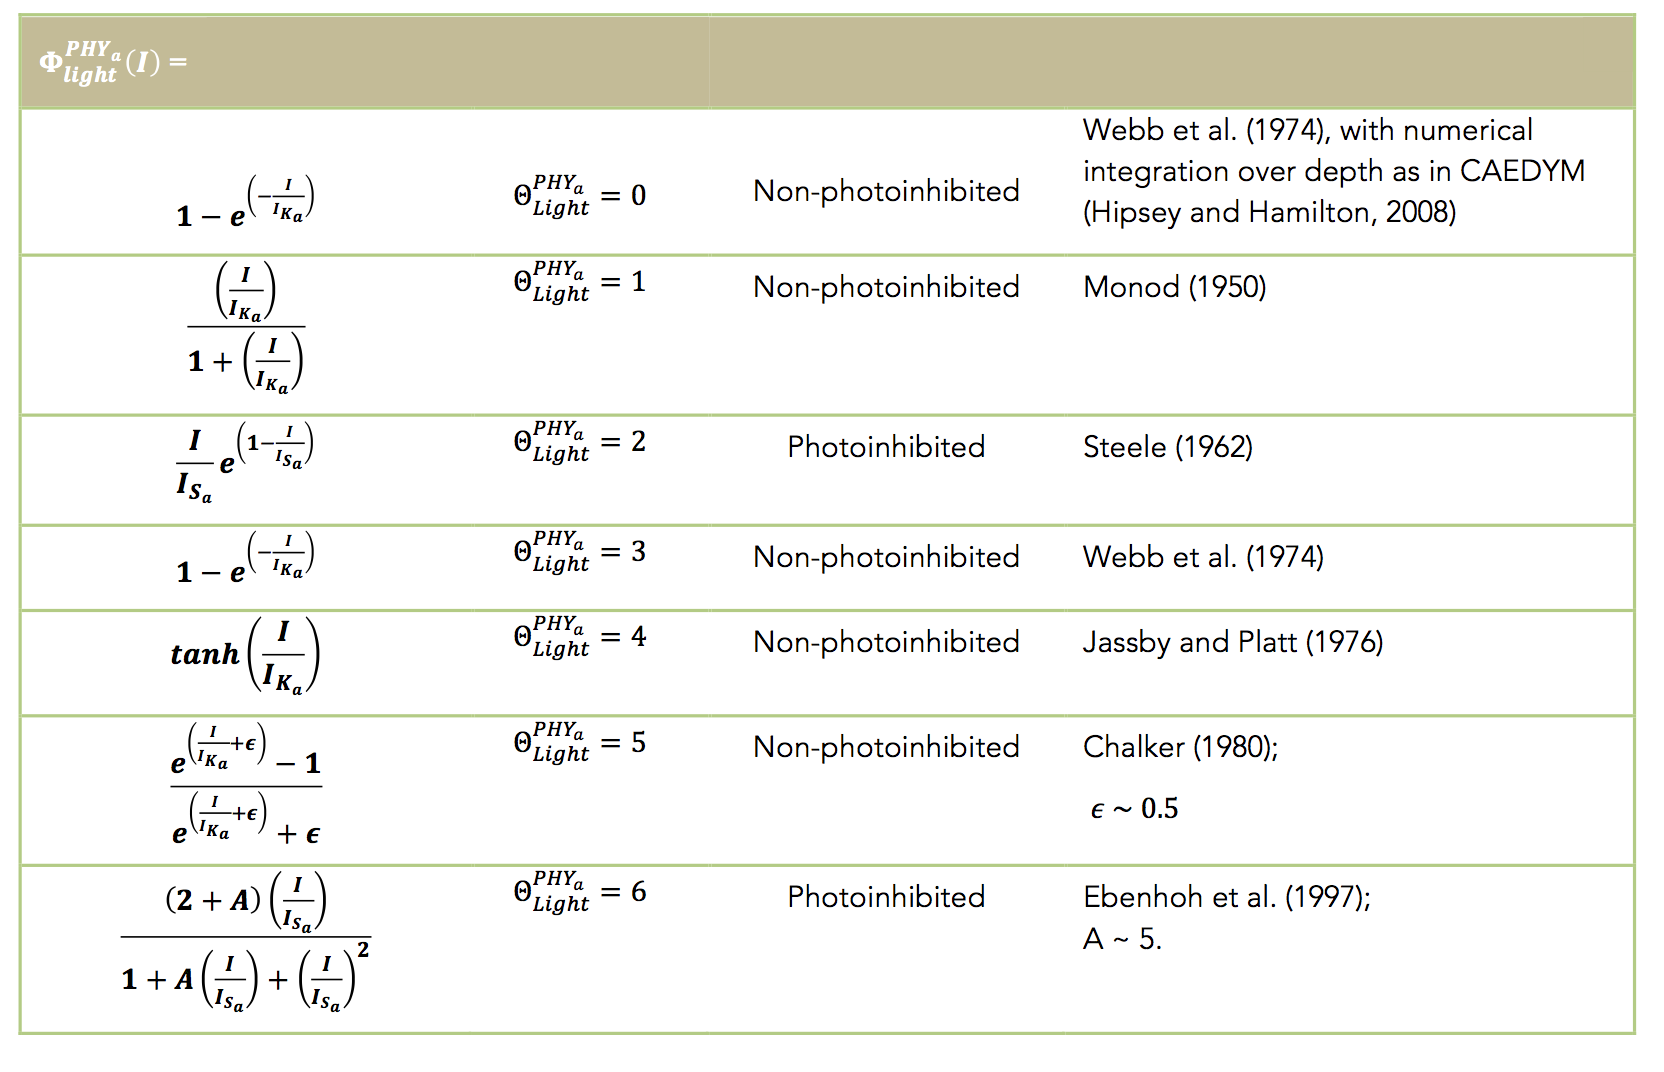
The aed_phytoplankton module contains several light functions, including those from a review by Baklouti et al. (2006). The user must select the sensitivity to light according to a photosynthesis-irradiance (P-I curve) formulation and each species must be set to be either non-photoinhibited or photoinhibited according to the options in the table below:
Limitation of the photosynthetic rate may be dampened according to nitrogen or phosphorus availability, and this is either approximated using a Monod expression of the static model is chosen, or based on the internal nutrient stoichiometry if the dynamic (Droop uptake) model is selected.
For advanced users, an optional metabolic scaling factor can be included to reduce the photosynthetic capacity of the simulated organisms, for example due to metabolic stress due to undertaking N2 fixation:
trient stoichiometry if the dynamic (Droop uptake) model is selected.
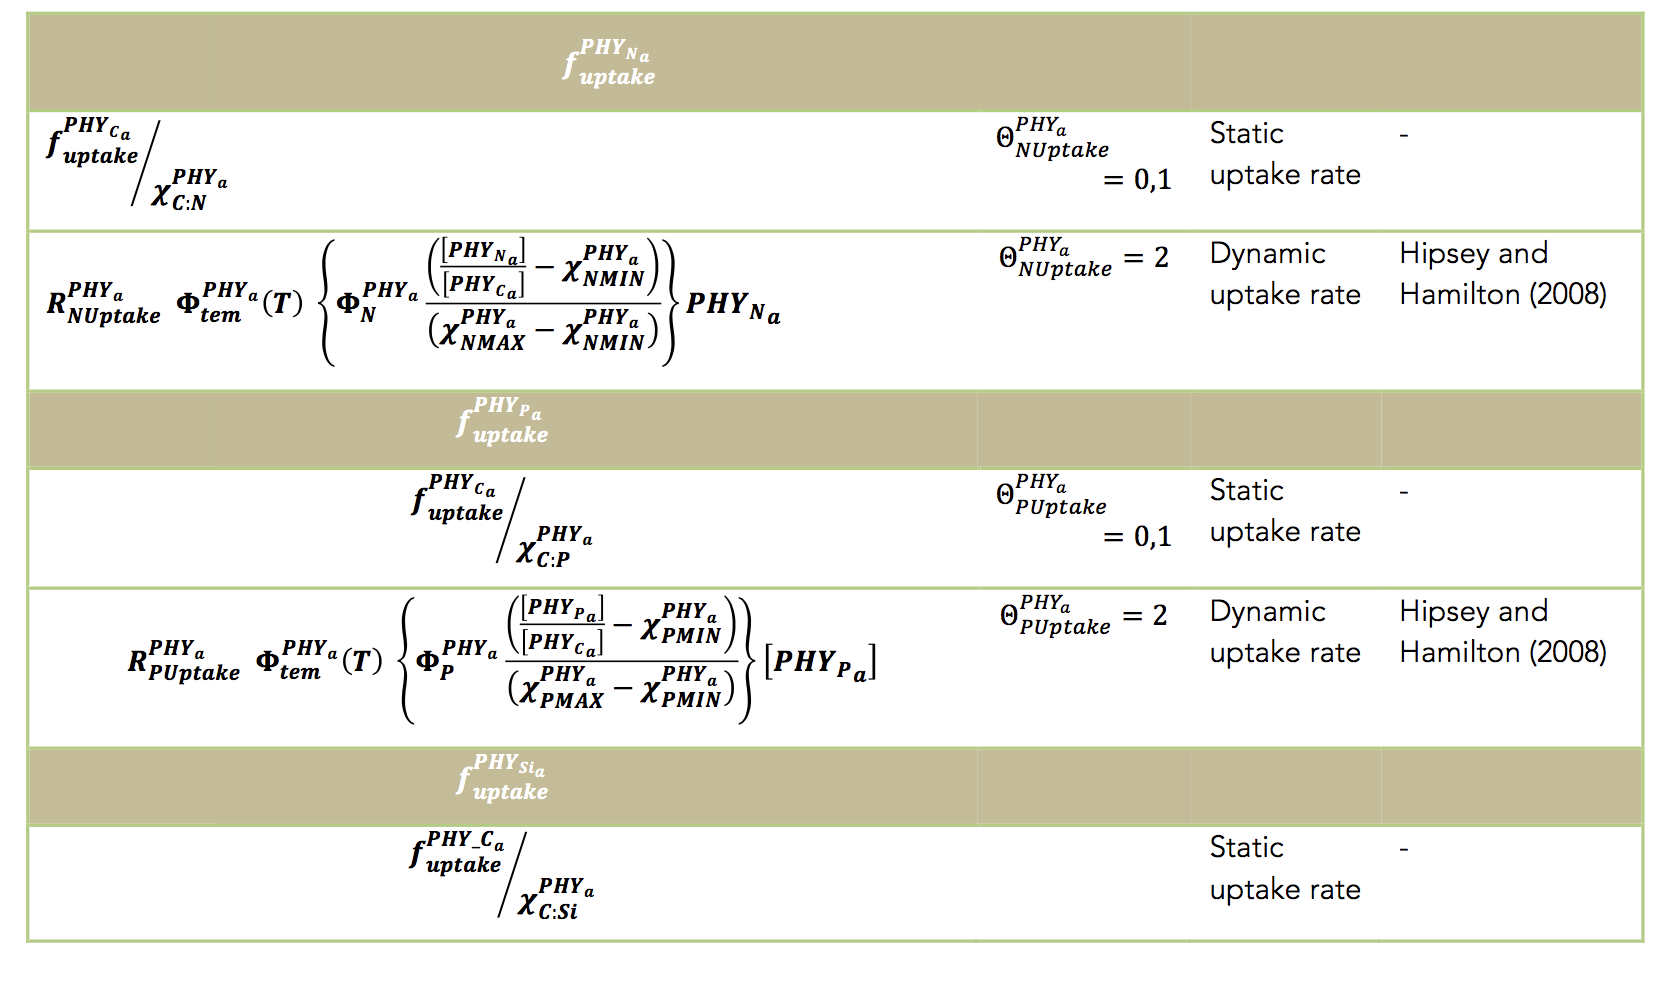
The above discussion relates to photosynthesis and carbon uptake by the phytoplankton community. In addition users must choose one of two options to model the P, N uptake dynamics for each algal group: a constant nutrient to carbon ratio, or dynamic intracellular stores. For the first model a simple Michaelis-Menten equation is used to model nutrient limitation with a half-saturation constant for the effect of external nutrient concentrations on the growth rate.
The internal phosphorus and nitrogen dynamics within the phytoplankton groups can be modelled using dynamic intracellular stores that are able to regulate growth based on the model of Droop (1974). This model allows for the phytoplankton to have dynamic nutrient uptake rates with variable internal nutrient concentrations bounded by user- defined minimum and maximum values (e.g., see Li et al., 2013).
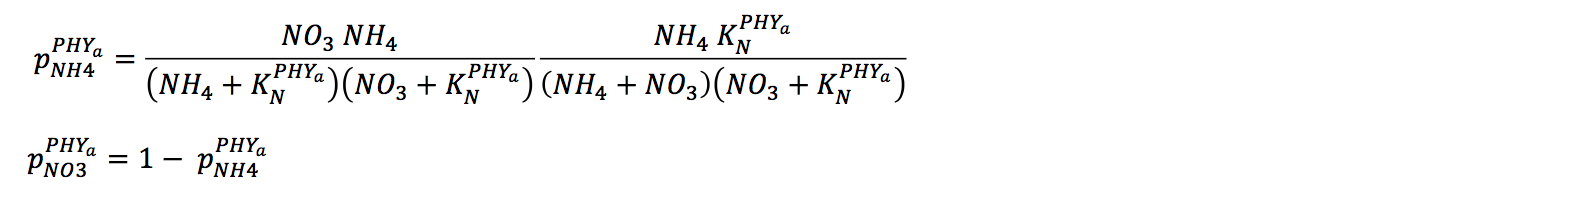
The uptake of nitrogen must be partitioned into uptake of NO3, NH4 and potentially labile DON. In the present version, distinction between uptake of NO3 and NH4 is calculated automatically via a preference factor:
For diatom groups, silica processes are simulated that include uptake of dissolved silica. The silica limitation function for diatoms is similar to the constant cases for nitrogen and phosphorus which assumes a fixed C:Si ratio.
aed2_phytoplankton : respiration, excretion and mortality
Metabolic loss of nutrients from mortality and excretion is proportional to the internal nitrogen to chl-a ratio multiplied by the loss rate and the fraction of excretion and mortality that returns to the detrital pool. Loss terms for respiration, natural mortality and excretion are modelled with a single ‘respiration’ rate coefficient. This loss rate is then divided into the pure respiratory fraction and losses due to mortality and excretion. The constant fDOM is the fraction of mortality and excretion to the dissolved organic pool with the remainder into the particulate organic pool.
Nutrient losses through mortality and excretion for the internal nutrient model are similar to the simple model described above, except that dynamically calculated internal nutrient concentrations are used.
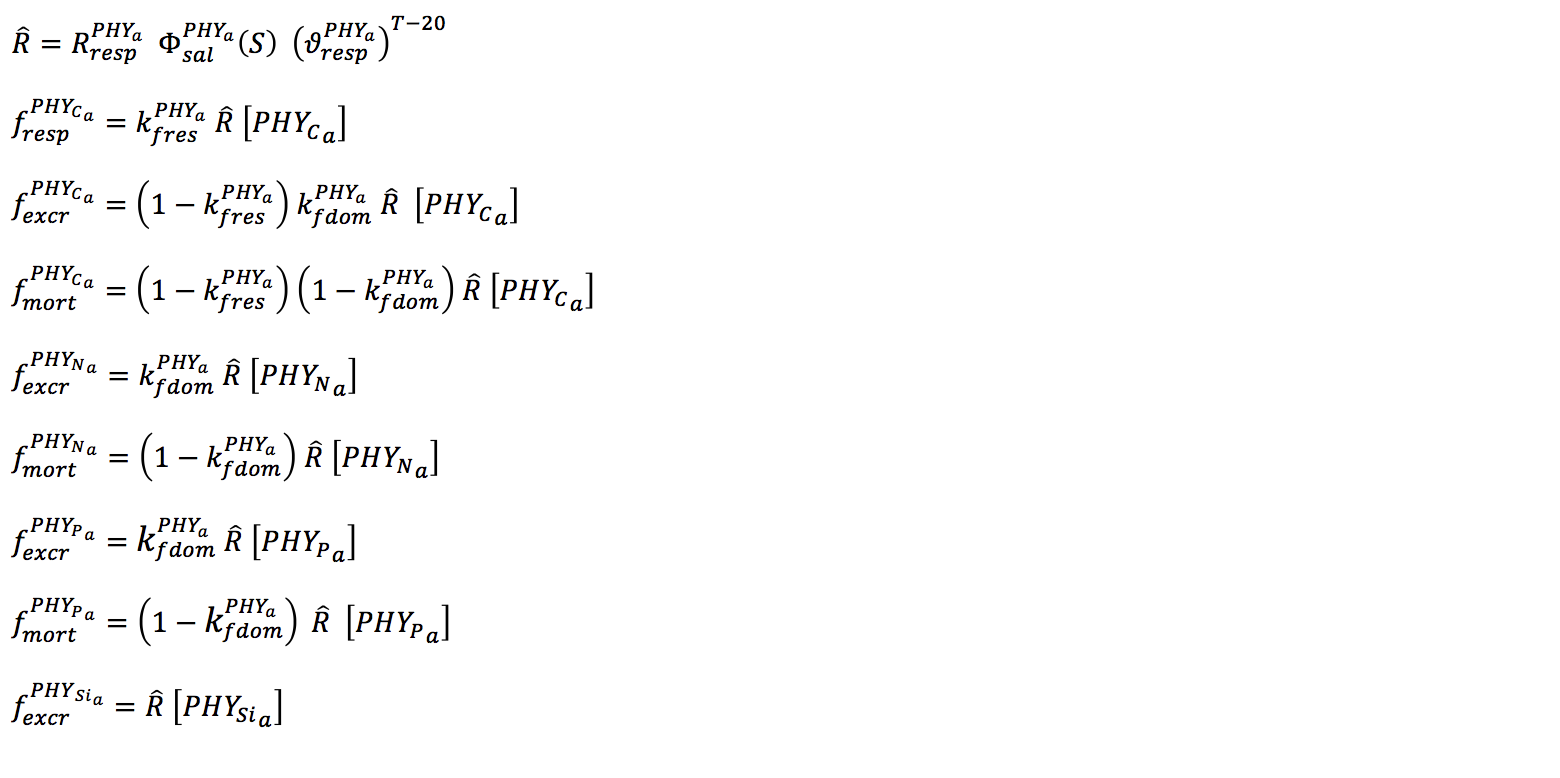
The salinity effect on mortality is given by various quadratic formulations, depending on the groups sensitivity to salinity (Griffin et al 2001; Robson and Hamilton, 2004).

Variable Summary & Setup Options
| Variable Name | Description | Units | Variable Type | Core/Optional |
|---|---|---|---|---|
PHY_{Group} |
phytoplanton group | $$mmol\,m^{-3}$$ | pelagic | core |
PHY_{Group}_IN |
internal nitrogen of phytoplakton group x | - | - | optional |
PHY_{Group}_IP |
internal phosphorus of phytoplakton group x | - | - | optional |
| Variable Name | Description | Units | Variable Type | Core/Optional |
|---|---|---|---|---|
PHY_tchla |
total chlorophyll-a | $$ug\,L^{-1}$$ | pelagic diagnostic | core |
PHY_GPP |
gross primary production | $$mmol C\,m^{-3}\,day^{-1}$$ | pelagic diagnostic | core |
PHY_{group}_f(I/T/S/N/P/Si) |
phytoplankton growth limitation of light/nutrients | - | pelagic diagnostic | core |
PSED_PHY |
phytoplankton sedimentation | $$mmol\,m^{-2}\,s^{-1}$$ | - | - |
PHY_NCP |
net community production | $$mmol\,m^{-3}\,day^{-1}$$ | - | - |
PHY_NUP |
nitrogen uptake | $$mmol\,m^{-3}\,day^{-1}$$ | - | - |
PHY_PUP |
phosphorus uptake | $$mmol\,m^{-3}\,day^{-1}$$ | - | - |
PHY_CUP |
carbon uptake | $$mmol\,m^{-3}\,day^{-1}$$ | - | - |
PHY_PAR |
photosynthetically active radiation | $$W\,m^{-2}$$ | - | - |
PHY_IN |
phytoplankton nitrogen | $$mmol\,m^{-3}$$ | - | - |
PHY_IP |
phytoplankton phosphorus | $$mmol\,m^{-3}$$ | - | - |
PHY_MBP |
microphytobenthos | $$mmol\,m^{-2}$$ | - | - |
PHY_BPP |
benthic productivity | $$mmol\,m^{-2}\,day^{-1}$$ | - | - |
PHY_MPBV |
microphytobenthos vertical ewxchange | $$mmol\,m^{-2}\,day^{-1}$$ | - | - |
PHY_PPR |
gross phytoplankton p/r ratio | - | - | - |
PHY_NPR |
net phytoplankton p/r ratio | - | - | - |
PHY_{Group}_NtoP |
- | - | - | - |
| Parameter Name | Description | Units | Parameter Type | Default | Typical Range | Comment |
|---|---|---|---|---|---|---|
num_phytos |
number of phytoplankton groups | - | integer | 0-7 | - | |
the_phytos |
list of ID's of groups in aed_phyto_pars.nml (len=num_phyto) | - | integer | 1/07/2017 | - | |
X_excretion_target_variable |
state variable to receive C, N or P from excretion | - | string | - | - | - |
X_mortality_target_variable |
state variable to receive C, N or P from mortality | - | string | - | - | - |
X_uptake_target_variable |
state variable to be linked C, N, P, Si or O2 uptake | - | string | - | - | - |
settling |
settling calculation method | - | integer | 1/03/2017 | - | |
do_mpb |
switch to enable microphytobenthos calculations | - | float | - | - | |
R_mpbg |
maximum rate of MPB growth | $$mmol C\,m^{-3}\,day^{-1}$$ | float | 5e-01 | - | - |
R_mpbr |
maximum rate of MPB respiration | $$mmol C\,m^{-3}\,day^{-1}$$ | float | 5e-02 | - | - |
I_Kmpb |
half saturation constant for light limitation of MPB growth | $$microE\,m^{-2}\,s^{-1}$$ | float | 100 | - | - |
mpb_max |
maximum MPB biomass | - | float | 2000 | - | - |
resuspension |
resuspension rate of phytoplankton group x | - | float | - | - | |
resus_link |
resuspension link variable | - | string | - | - | - |
n_zones |
total number of active material zones | - | integer | - | - | - |
active_zones |
Active material Zone ID's | - | array | - | - | - |
dbase |
link to phy database | - | string | - | - | - |
extra_diag |
include extra diags in nc output | - | boolean | .false. | - | - |
min_rho |
minimum phytoplankton density | $$kg\,m^{-3}$$ | float | 900 | - | - |
max_rho |
maximum phytoplankton density | $$kg\,m^{-3}$$ | float | 1200 | - | - |
An example nml block for the phytoplankton module is shown below.NOTE: Users must supply a valid "aed_phyto_pars.nml" file.
  &aed2_phytoplankton
!-- Configure phytoplankton groups to simulate
  num_phytos = 1
  the_phytos = 1
  settling =   1
!-- Benthic phytoplankton group (microphytobenthos)
  do_mpb = 1
  R_mpbg = 0.5
  R_mpbr = 0.05
  I_Kmpb = 100.
  mpb_max = 2000.
  resuspension = 0.45
  resus_link   = 'TRC_resus'
  n_zones = 4
  active_zones = 2,3,4,5
!-- Set link variables to other modules
  p_excretion_target_variable='OGM_dop'
  n_excretion_target_variable='OGM_don'
  c_excretion_target_variable='OGM_doc'
  si_excretion_target_variable=''
  p_mortality_target_variable='OGM_pop'
  n_mortality_target_variable='OGM_pon'
  c_mortality_target_variable='OGM_poc'
  si_mortality_target_variable=''
  p1_uptake_target_variable='PHS_frp'
  n1_uptake_target_variable='NIT_nit'
  n2_uptake_target_variable='NIT_amm'
  si_uptake_target_variable='SIL_rsi'
  do_uptake_target_variable='OXY_oxy'
  c_uptake_target_variable=''
!-- General options
  dbase = '../External/AED2/aed2_phyto_pars.nml'
  extra_diag = .false.
 !zerolimitfudgefactor = ??
  min_rho = 900.
  max_rho = 1200.
 /
Examples
Publications & References
To be completed ...